October 2025- Big update with additional features and substantial optimization. Now up to version 3.11
You can find it here
Enhancements include…
- Added Returns over common investment timeframes- YTD, 1, 3, 5, 10, All, Custom. You choose any Group. or Account, or All that have one of the chosen Cash Flow Transactions.

-
More accurate return %s as it uses actual cash flow dates instead of monthly granularity
-
Added more information to Single Account tab
-
Fixed YTD returns for Monthly Investment tab
-
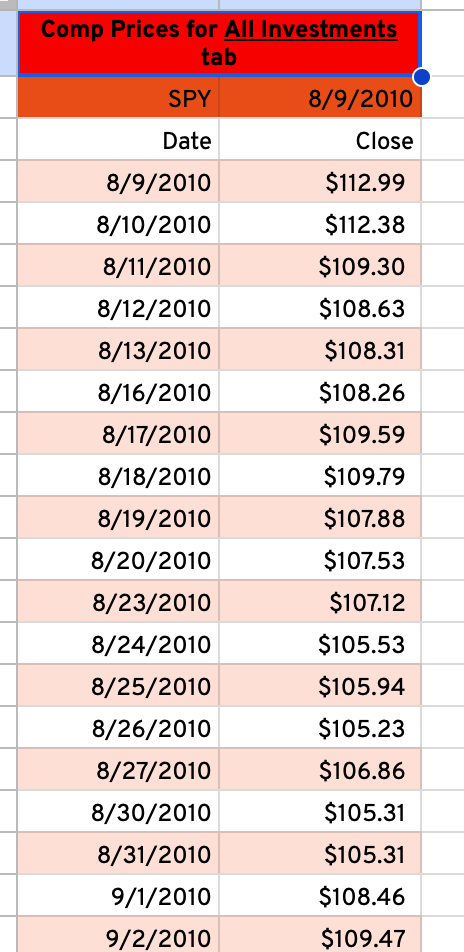
Comparison ticker pulls daily values instead of weekly to get more accurate ticker comparisons
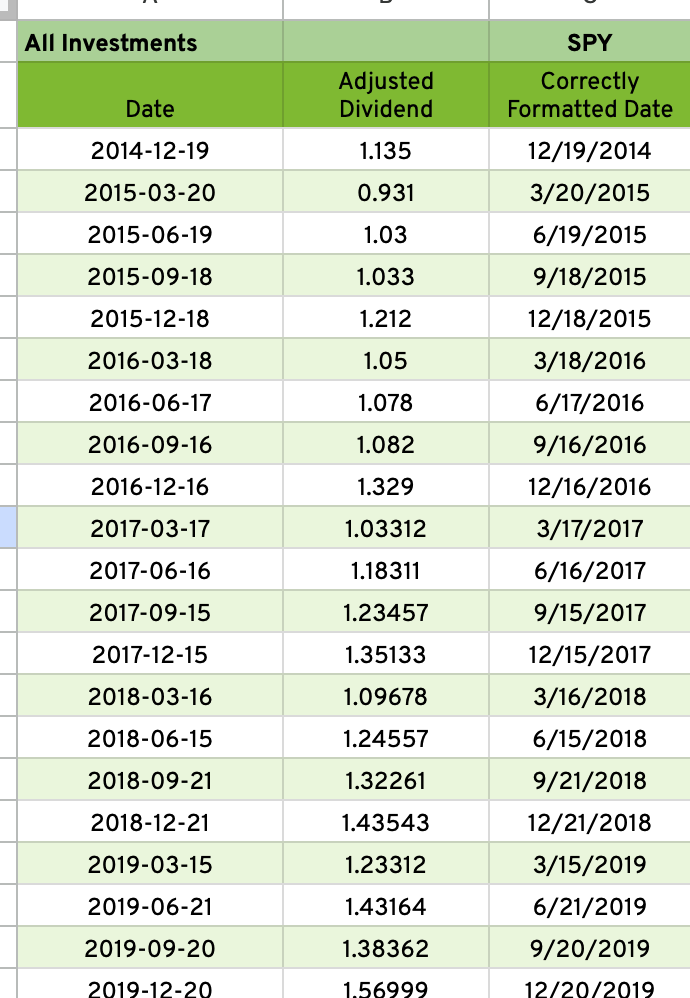
- Added capability to include reinvested dividends if the comparison ticker has dividends. This only works if you subscribe to WiseSheets and have the Google Sheets extension. If you don’t, it doesn’t affect the sheet. As of when I’m writing this post, annual cost of Wisesheets is $60 but you can find a $10 off coupon to make it $50 for the first year.
- Optimized Importrange function for Transactions to only pull in transactions that have Investment categories you choose (was pulling in all transactions). I have >13k transactions in my Tiller foundation sheet, <1k for my chosen investment categories
- Optimized importrange function for Balances to only pull in Asset accounts
- Can now choose up to 30 Investment accounts instead of 20
In terms of optimization…
- My file size for Version 3.1 is 353k vs 642k for v2.3 (yours may be different based on the amount of data it imports)
- Number of columns in “Set up and Calcs” tab has dropped to 144 for v3.1 vs 516 for v2.3; all while increasing the # of accounts from 20 to 30
- Although not quantitative, it seems to load much faster and update its calcs substantially quicker when I change something.
Set up
No change in the setup from previous versions. For all the tabs except the Waterfall tab, in the Set up and Calcs tab…
- Choose your Cash Flow Categories
- Choose the Accounts you want to include
- You can now choose which Account Groups you want to include if you have more than 5. By default, it chooses all of them.

You choose separate categories for the Waterfall tab in that tab…

I appreciate any feedback or questions anyone has.
September 2025 Update (Rev 2.3)
Based on @jmilner suggestion on Aug 24, 2025, I added additional tab with a waterfall chart where you can choose start and end dates. Tab is called “Waterfall”. You can find this updated version here
You choose up to 2 Accounts or Groups and your start and end dates and the Categories for the different contributors to the chart. It produces a waterfall chart like this…

The Categories are chosen in the grouped columns to the right…

These Categories are independent of the Cash Flow categories you choose in the Setup and Calcs tab.
I also optimized the multiple ImportRanges calls so it loads faster and more reliably than previous versions. And, for those who were seeing “results too large” (@aaron18, @MidnightPrzm, @MC_Matthew, there may be others), this issue should no longer happen.
Lastly, I fixed some minor errors I was seeing.
Enjoy.
August 2025 Update (Rev 2.2)
I have made some improvements and the Revision is now 2.2. You can find it here.
Improvements are:
- Increased total # of accounts you can track from 15 to 20. Still limited to 5 Groups
- Increased total number of years you can show on the “All Investments” tab from 25 to 35 years
Thank you.
March 2025 Update (Rev 2.1)
Fixed error when there is an in-cell image in the ImportRange() range.
- Rev 2.1 can be found here.
February 2025 Update (Rev 2.0)
Some of you have had issues with the load time so I rearchitected the workbook and optimized it quite a bit.
- Rev 2.0 can be found here
I am seeing the time between loading from scratch to completing the calculations improve by 35-40% vs the previous Rev.
I also added some new features and tweaked how to set it up…
-
You can now choose a comparison ticker on the Monthly Investments sheet, like you could before on the other 2 tabs
-
Added annual balances to the chart on the Single Investment sheet
-
You now need to choose your Investment Cash Flow categories and accounts to include in the “Set Up and Calcs” sheet. This is a change from previous versions, where you set these up on the “Single Investment” sheet.


I am also thinking about increasing the number of investment accounts you can select from 15 to 20, but that will add ~50 columns in the “Set up and Calcs” sheet. I’ll post if I make that update.
October 2023 Update- (Rev 1.6)
- @wally.bryan found error on the All Investment tab. This fixes that error.
- Rev 1.6 can be found here
July 2023 Update- Part 3 (Rev 1.5)
- Update based on my July 23 post below. Rev 1.5 can be found here
- This updates allows a larger number of Balance History cells to be imported. @jmilner uncovered a scenario where importrange reached its limit of importing 175,000 cells from Balance History. I updated the importrange function to pull in 1 column of Balance History at a time.
July Update 2023- Part 2 (Rev 1.4)
-
I finally figured out how to (correctly) calculate Total Returns= (Current Balance + Withdrawals [assuming WDs are positive #s*])/(Total Deposits)*
-
I also use this to calculate YTD returns- counting Beginning Balance of the year as a deposit.
-
Optimized multiple formulas.
The updated file (Rev 1.4) is here.
July 2023 Update (Rev 1.3)
-
Updated the YTD performance formulas to provide more accurate returns %s
-
Corrected a few misc errors
The updated file (Rev 1.3) can be found here
If you used a previous version, please updated to this one if you run into any errors; and let me know if you encounter any issues.
March 2023 Update
-
Fixed the EOM error on Monthly Investment sheet. It was pulling BOM, not EOM.
-
Updated the workbook to allow up to five categories to be used as Cash flow in/out of Investment accounts. Original was 1 category. You enter these categories on the “Single Investment” sheet.
-
Misc improvements

The updated file can be found here.
What is the goal of your workflow? What problem does it solve? How does it help you?
Goal is to automatically calculate monthly, annual, and XIRR returns on market investments and to compare these returns to any market ticker (e.g. SPY, QQQ, GOOG, etc.).
Before I discovered Tiller, I had created a spreadsheet to calculate these items. Every month I would manually enter the net monthly cash flows and ending balance for all my investment accounts. When you have many different accounts with multiple institutions, this takes a while.
I also wanted to group my investments (Education, Retirement, All, etc.) so I could determine returns on these groups as well.
Automating this task saved a lot of time and it also automatically adds in new accounts and groups.
How did you come up with the idea for your workflow?
I had created this spreadsheet a while ago to calculate these items and wanted to make it easier to determine my returns.
What are the sheets included with your template? Does your workflow use any custom scripts or formulas?
Prior to Rev 2.0, there are 3 included, they are explained below. Rev 2.0 moves all the setup and calculations to the… “Set Up and Calcs” sheet.
There are no custom scripts or formulas.
Is it ok for others to copy, use, and modify your workflow?
Absolutely. Here is the link- Investment Returns
Set up and use
All 3 sheets use the same philosophy…
- This only works on Asset accounts that have a Balance and at least 1 deposit. The workbook determines which accounts are valid.

The first transaction date for each account should be when you make the initial deposit into that investment account.
- If you know your cash flows and balances for any investment account by month, you can determine your return by month, year, lifetime. The smallest time period allowed is by month.

In order for the spreadsheet to calculate returns, you need to choose the category types for your deposits and withdrawals into your investment accounts. You can choose up to 5 categories. I only use one Cash Flow Category- “Investment Cash Flow”, but you can name it anything you want and choose those Categories in the “Single Investment” sheet.
Examples of Cash Flow Category Transactions are…
- 401k contributions (I classify my and my company’s contributions the same so the company’s contributions do not artificially inflate my return)
- Your Brokerage account deposits and withdrawals
You do not want to classify any Transactions that are internal to the Account. Internal Transactions include…
- Automatic dividend reinvestment
- Market change Transactions
- Fees
- etc.
- Once you can generate the above table for any Account or Group, you can determine any type of return!

The Sheets
- Single Investment sheet

You can pick any valid Account, the associated Account Groups, or All accounts.
You can also choose a Comparison Ticker (e.g. SPY, QQQ, GOOG, etc.) The sheet automatically determines what the returns are for this comparison ticker using the same deposit and withdrawals you put into the Account, Group, or All. FYI- Sometimes, GoogleFinance is not able to pull the data needed for the comparison. This seems random but you’ll see this in the table as “[ticker] issue”.
The sheet is limited to 20 accounts total. Even if you have < 20 valid Accounts, you still need to determine which Accounts to include…

You can have all your accounts in one Group or split between multiple Groups. The maximum number of Groups = maximum number of Accounts = 20.
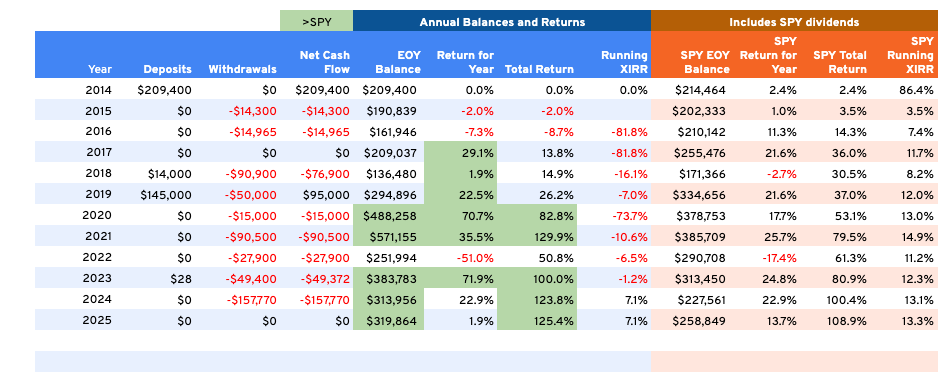
- All Investments sheet

This sheet consolidates the returns on all the individual Accounts and Groups into 1 sheet. You can choose which Accounts, Groups, or All to include in the table.
Since the sheet has to know the returns on all Accounts and Groups, it is limited to 15 accounts total and 5 Account Groups. All 15 Accounts can be in 1 Group or split between the 5 Groups. Even if you have <= 15 valid Accounts, you still need to determine which Accounts to include.
If the Accounts you choose result in >5 Groups, only the first 5 Groups alphabetically will be available
As with the Single Investment sheet, you can also choose a Comparison Ticker (e.g. SPY, QQQ, GOOG, etc.) The sheet automatically determines what the return would have been on this comparison ticker using the same deposit and withdrawals from the Account, Group, or All. FYI- Sometimes, GoogleFinance is not able to pull the data needed for the comparison. This seems random but when it happens you’ll see this in the table as “[ticker] issue”.

The summary table is currently set up for 25 years from the earliest investment cash flow category for all your accounts. You can change the Sequence formula to customize this. If you want to add more years, you would need to add more columns to the right of the display columns and change the Sequence formula…
![]()
- Monthly Investments sheet

Choose which Account or Group you want and it will show you the returns by month. You can choose a month on the right and it will show EOM balances for all accounts.
Corner Cases/Error Handling (what should happen ![]() )
)
- What if you don’t have a deposit prior to the balance date?
The sheets use the first Transaction date as the starting date for each Chosen account. If you have a Balance prior to the first deposit and want to include it, manually enter an earlier deposit.
- What if I don’t have a Balance for each month?
- If it is the first Transaction month of the account, Balance = the initial deposit.
- If it is not the first Transaction month, Balance = previous month’s balance
Misc
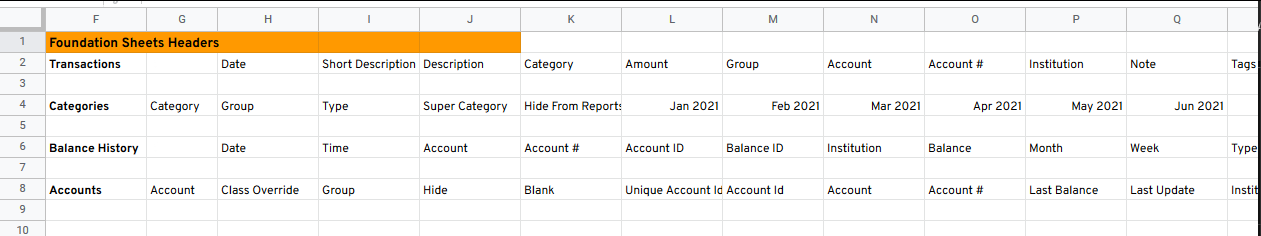
This spreadsheet is decent sized and very processor intensive. Because of this, I have these sheets in a separate workbook from my main Tiller workbook and use Query(ImportRange) to filter the 4 Foundation sheets you need- Transactions, Categories, Accounts, and Balance History. I strongly suggest you start this way as well.
To help with this, there is sheet called “Tiller Connection”. Put your Tiller workbook URL into this sheet and choose your Cash Flow Categories in the Single Investment sheet. This workbook will automatically import and filter the Transactions, Categories, Accounts, and Balance History data it needs. If the Transactions, Categories, Accounts, and Balance History sheets are blank, you either have the wrong URL for your main Tiller workbook or you haven’t allowed a connection between the 2.
Enjoy and let me know if you have any questions.
Scott