Tiller for EXCEL:
Looking for a simplistic BUDGET Review SHEET that shows each month’s line item performance performance (monthly expenses vs. budget amount) along with the YTD Annual totals for each line. Were not concerned about tracking the INCOME…as were retired and our income is simple.
Our EXPENSES however are a bit more detailed.
When I say “simplistic”, I mean that we are looking for a sheet with:
- NO fancy graphs
- ONLY Month and YTD $$$ totals for each budgeted line item
- NO comparisons of cash flow or other INCOME vs. EXPENSE
summarizations. That data is on several other sheets.
Unless I am just not seeing it, the Tiller Community “MONTHY ANALYSIS” sheet has MOST of this details (albeit more wallpaper than we need). However, it does not appear to provide the LINE ITEM totals for each budget item … so there is no apparent quick view (projection) of how we are tracking with relationship to our yearly total for that line item.
While I understand Excel, I do admit that I am more of an Excel novice when it comes to the imbedded and linked Formulas that are used in Tiller. Therefore I do not feel confident enough to try to add a TOTAL column without screwing up the sheet formatting … or my entire Tiller template.
Am I missing something on this SHEET or is there another SHEET I should consider that will give me the simple data I want?
Would the Yearly Budget or Live Profit and Loss sheets meet your needs?
I think the new Simple P&L report that’s available in Tiller Money Feeds meets most of these needs as well.
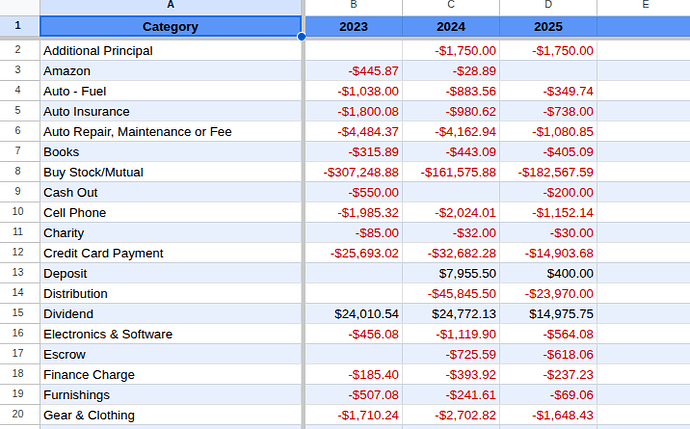
I have a sheet where I total items for each category, grouped by year. It uses he following QUERY:
=QUERY(Transactions!$B$1:$P,"select D,SUM(E) where F <> 'Investment' and D <> 'Transfer' and D <> 'Payment Posted' and year(B) > 2022 group by D pivot year(B)",1)
Transaction fields:
B – Date
D – Category
E – Amount
F – Group
To that I add some color formatting to show negative amounts in red.
Looks something like:
The ‘Buy Stock/Mutual’ makes me look something of a whale, but that is mostly rebalancing done on investment accounts or re-investment of dividends. 
I also have trailing columns
YoY Change Difference 2025-2024
YYYY Monthly Average (one for 2023,2025 and 2025)
For previous years the average is just the category total / 12. For current year, I get the MONTH from a cell whose value is TODAY() for the divisor.
1 Like
Interesting…but I’m not quite sure I follow how to set up MY sheet in Tiller and apply the formula you noted. Gussying up the page with color accents I got.
Scott
1 Like
Hi, Scott.
I created a new sheet and put the formula in the A1 cell of that new sheet I named it ‘Categories YoY’, but that name isn’t important. The query should give at least one column of years.
Here is an example QUERY with no filtering 
=QUERY(Transactions!$B$1:$P,"select D,SUM(E) group by D pivot year(B)",1)
@ramerkw this would be a cool show & tell to add here  Sheets Templates - Tiller Community
